Few weeks ago on LinkedIn, a post of ours gave rise to a heated debate among insurance professionals. All that the post said was, ‘Yelp will soon be used as one of the major sources of data for underwriting’.
Insurance experts chipped in to say how bots have taken over the reviews on Yelp and fake reviews and ratings run rife across most of the social sites. They had a point – ‘How can big data sources be credible?’.
The other day, we even chanced upon this video that shows you five different ways in which you can manipulate wearables data! An insurer’s nightmare.
Small wonder then that insurers are wary of big data sources as their numbers continue to grow phenomenally.
What if all of big data is wrong?
Fake reviews in social media sites and instances of jailbreaks of devices are no reason to avoid using big data in insurance. Because fraudsters always slither into any system.
Data scientists and big data engineers are known to swear by ‘Veracity’ of big data. And for this reason insist of cleaning data sets. However, with streaming big data, the longer you wait to clean the data, the more quickly it decays.
Instead of donning hand gloves and masks to clean and sanitize data, a better way to ensure its credibility is to assume that all of it is wrong! Yes, that’s right, assume that all of the big data you are working with is infected and work backwards from there.
Enter Triangulation
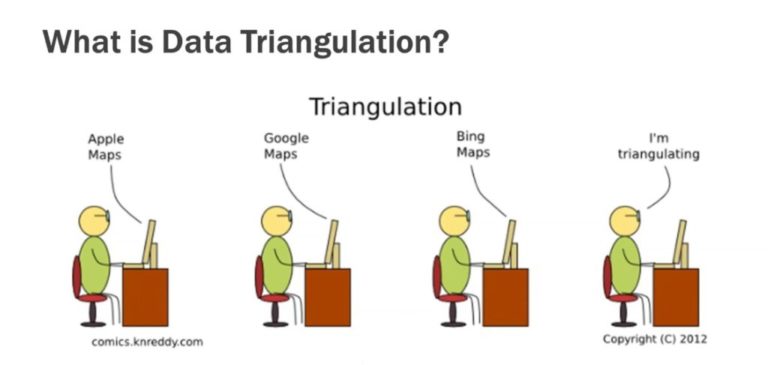
Essentially, your focus is NOT on establishing a single source of truth, but rather on identifying those strains of truth which are likely present in the data by using a method called triangulation. To illustrate further, just because you trust revenue from source A, does not mean you should trust employee count from the same source.
As a term, triangulation has its origins in qualitative research. And, in the context of big data, it is used to verify the accuracy of a data source by corroborating it with two similar or disparate elements.

And of course, in the case of big data, triangulation can only be implemented with a machine learning algorithm. Machines alone can handle the volume and complexity of the data, and become smarter over time.
Examples of data triangulation include:
Fixing a bad address by verifying the data from static forms with addresses found on social media, news websites and GPS data.
Revealing the safety practices of a manufacturing company using data sources such as Enforcement and Compliance History Online (ECHO), news mentions in Google, independent third party data sources such as HazardHub.
Detecting red flags in leadership of businesses by using a combination of sources—social media such as Glassdoor, news websites and paid sources such as D&B.
Uncovering financial irregularities of a risk with the help of Paydex sources, review websites and news mentions.
How can you rest assured (well, relatively) with triangulated big data?
- Ensure the bedrocks of underwriting are solid: To start from the fundamentals, you will have to ensure that all the data for your base rates for risks are correct. This includes simple validations that need to be performed on full-time equivalent (FTE), insured location (we have seen latitude/longitude being off by even 100 miles), SIC/NAIC codes, year founded, who the directors are of the company, etc. The problem however is that they are off systematically by 15-20% based on the books we have run. So, before even trying to get an edge on unstructured data, the basics of triangulation can help you straight away.
- Confirm loyal customers and reward them: Insurance has been notorious when it comes to rewarding loyal customers. With the use of big data that has been verified over time, repeat customers can finally get their dues.
- Establishes a culture of evidence and enables transparency with customers: The current underwriting and claims payout mechanism are mired in a lot of manual verification’s and involves blind faith on the part of customers as well as insurers. By using reliable big data, insurers can procure evidence in a non-invasive manner and enable a better customer experience.
To truly experience triangulation, get on to Intellect Risk Analyst today.
Sources:
